Then I plan to do an article about DesignXplorer, the tool in Workbench to do optimization, sensitivity studies, six sigma analysis, etc. and will end with an article about how to solve with RSM (Remote Solve Manager) and HPC (High Performance Computing).
We often talk about parametric simulations or parametric studies. The name parametric refers to the basic of these simulations, the parameters. Often we want to do simulations to see what happens if we change one or more parameters in our model, say the thickness of a plate, the radius of a hole, a material property etc. So the first thing we need to decide is what parameters are we interested in, should it include geometry dimensions, material properties, load and which output parameters (results) we are interested in. Either way the way of defining parameters in ANSYS Workbench is the same, we only need to click in box in front of the value.
We are not limited to geometry parameters from DesignModeler, we can also use parameters defined in SpaceClaim, Autodesk Inventor, CATIA V5, Creo Parametric, NX, Solid Edge and SolidWorks. If we use another CAD system than DesignModeler, there are a few things we need to think about. First the way of defining parameters in the different CAD system may vary so please consult the ANSYS help documentation for a more detailed instruction for each CAD system. Once the parameters are defined we need to tell ANSYS Workbench to process them. To do that we right click on the Geometry cell in the Project Page and choose Properties. Under “Basic Geometry Options” there are an option, “Parameters”, that should be checked to process the parameters. The option below, “Parameter Key”, is used to filter out our interesting parameters from the CAD. By default it is “DS”, meaning that only names prefixed or appended with "DS" will be processed. If blank, all independent parameters regardless of name are processed.
The processed geometry parameters from the CAD system will den be available in Mechanical, under Geometry in the “Outline”. To use the parameters we need to click in a “P” in the box in front of the name.
As soon as we have ticked in a “P” for some value we will see that a new cell called “Parametric Set” has appeared on the Project Page.
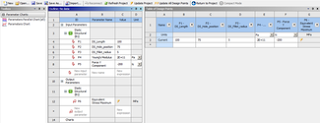
If we double click on “Parametric Set” we will see the following screen.
In the “Outline” window we see a summary of all the parameters that we have defined. From here we could define a parameter as a function of another and also create new parameters, for example the material cost.
To the right we have the “Table of Design Points” in which we define the values for the parameters. After creating a number of deign points we can solve all of them by clicking on “Update All Design Points”. Any open editor will close (such as Mechanical or DesignModeler) and the updates will be run in the background. By default the updates will be solved in sequence on the local machine but we have the option the use RSM (Remote Solve Manager) to send the design points to another machine for solving. More on that in an upcoming article.
After all design points have been solved and we see the values for the output parameters in the “Table of Design Points” we can use the “Parameters Chart” function to plot how an output parameter depends on the input parameter. The “Parameter Chart” is available from the “Toolbox” to the left and if we highlight one of our output parameters we get two extra options to directly create a graph with that output parameter on the y-axis. In the properties window of the “Parameter Chart” we decide what we want to plot in the graph. We can plot two graphs at the same time which is useful if we have to goals in conflict, for example if we want to minimize both the stress levels and the mass of a component.


